The Decision That Drives 90% of Your Returns
By Kevin Curley II, CFP®, CEPA® | Senior Wealth Advisor, Clearfront Advisory

Image created using AI by Google Gemini
Introduction
Investors spend enormous amounts of time and energy on questions that matter relatively little: which stock to pick, which fund manager to hire, whether to get in or out of the market right now. These feel like the important decisions. They are not.
The decision that drives the overwhelming majority of your long-run investment results is simpler and less exciting than any of those: what mix of asset classes do you own?
That mix — your asset allocation — is the single most powerful variable in your investment portfolio. Not the stocks you picked. Not the manager you hired. Not your market timing. In widely cited research on institutional portfolios, the ratio of equities to fixed income to cash and other assets has explained roughly 90% of the variability in portfolio returns over time. Everything else accounts for the remainder.
At Clearfront, our mission is to help you build wealth beyond work. Our integrated planning solution — ClearVision™, ClearCapital™, ClearCut™, ClearShield™, ClearScholar™, ClearLegacy™, and ClearExit™ — is the road to get there. This series is a good starting point for anyone new to these concepts, and a useful refresher for anyone who wants to revisit the fundamentals of how these tools work and why we use them.
Asset allocation is the core decision inside ClearCapital™. But here’s what most conversations about it miss entirely: for business owners, the investment portfolio is rarely the whole picture — and often not even the most important part of it.
What Asset Allocation Actually Means
Asset allocation is simply the makeup of your investment portfolio — what percentage is invested in which asset classes. The most basic expression is the ratio of equities to fixed income. A portfolio described as 100/0 is 100 percent stocks, zero percent bonds. A 60/40 portfolio is 60 percent stocks and 40 percent bonds. Everything flows from that ratio — your expected long-run return, your year-to-year volatility, how much you might lose in a bad year, and how quickly you might recover.
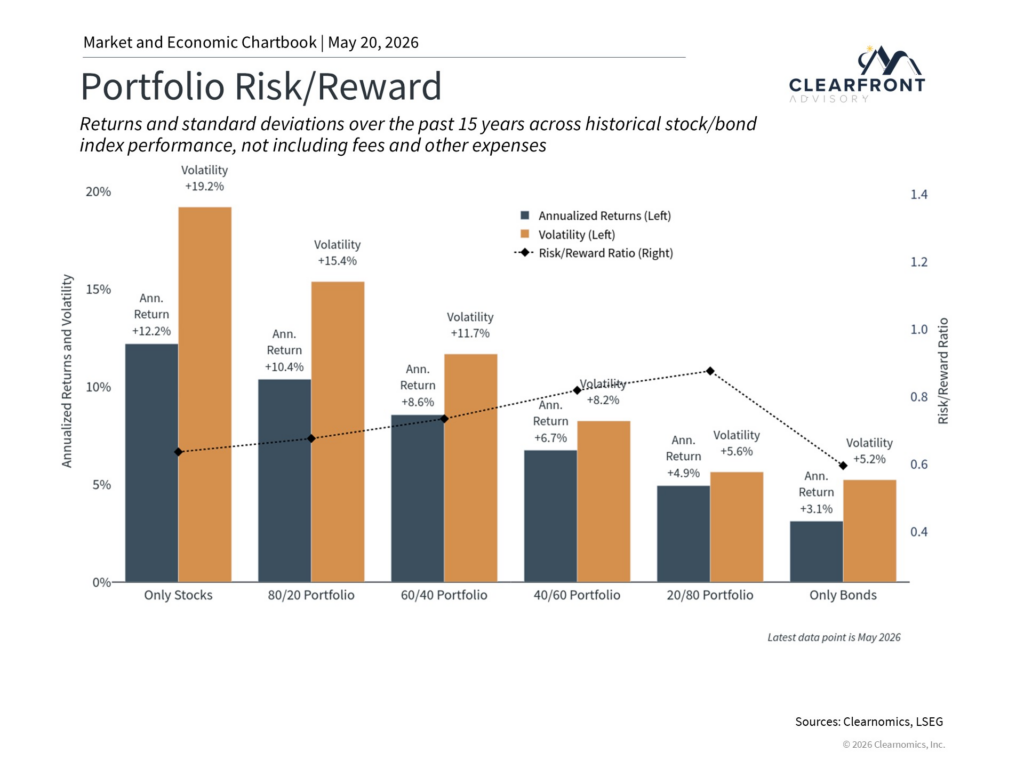
Exhibit 1: Asset class performance rotates from year to year—one reason diversification and disciplined rebalancing matter more than chasing last year’s winner. Source and index notes are shown in the visual (Clearnomics). Past performance is not indicative of future results.
The Research Behind the 90% Rule
In 1986, researchers Gary Brinson, Randolph Hood, and Gilbert Beebower published a landmark study in the Financial Analysts Journal examining what actually drives investment returns for large pension funds. Their finding — confirmed in a follow-up study in 1991 — was striking: asset allocation policy explained approximately 90 percent of the variability in portfolio returns over time. Active decisions like market timing and individual security selection explained the rest.
The implications are significant. If you get the asset allocation right, you have done most of the work. If you get it wrong — if your mix is too aggressive for your time horizon or too conservative for your growth needs — no amount of stock picking or manager selection will compensate for it.
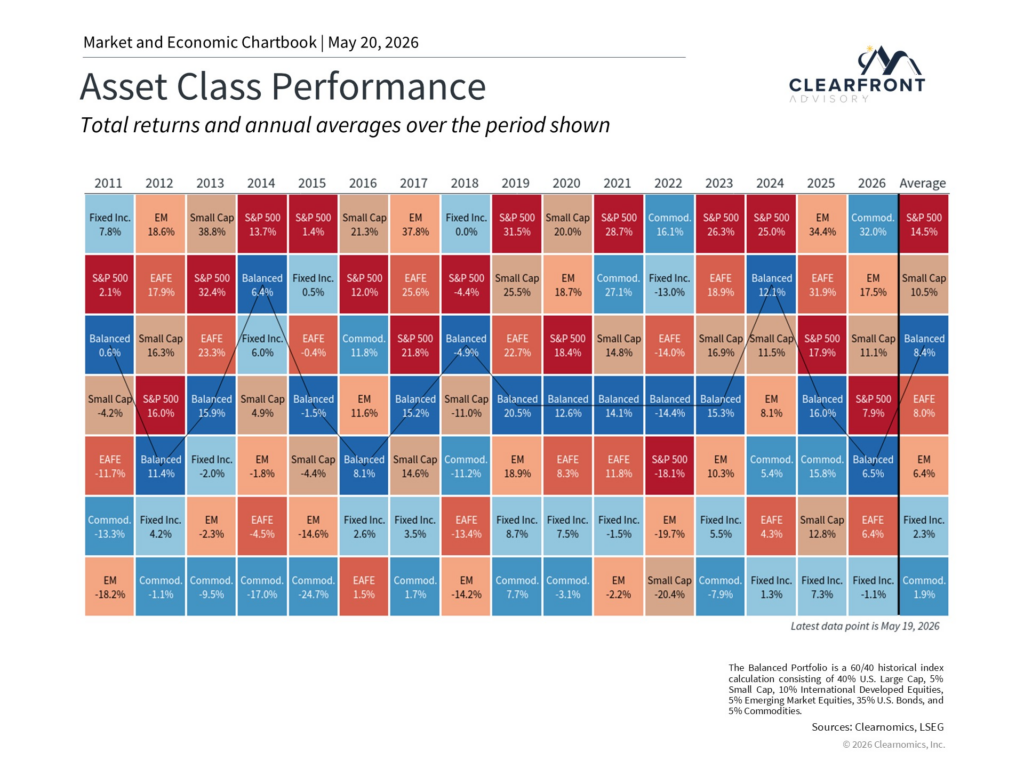
Exhibit 2: The classic Brinson studies are often summarized as: policy asset allocation explains the majority of long-run return variability across portfolios. This is about variability over time—not a guarantee of returns. Source details are shown in the visual (Clearnomics).
The Spectrum: From Aggressive to Conservative
100/0 — All Equity
A 100 percent equity portfolio is designed entirely for growth. Historically this has produced the highest long-run returns — but also the most volatility. In a severe bear market, a 100/0 portfolio can lose 40 to 50 percent of its value. This allocation is appropriate for investors with long time horizons of 20 or more years who can hold through significant drawdowns. Time horizon matters more than age. The question is not how old you are — it is when you need the money.
80/20 — Aggressive Growth
An 80/20 allocation adds a modest fixed income component — enough to provide ballast during equity downturns without meaningfully reducing long-run growth potential. The 20 percent in bonds gives the portfolio something to rebalance from when stocks decline. A common allocation for investors still firmly in the accumulation phase who want some reduction in peak-to-trough volatility.
60/40 — The Classic Moderate Portfolio
The 60/40 portfolio is perhaps the most studied allocation in investment history. It has served as the default moderate portfolio for individuals and institutions for decades — delivering meaningful equity-like growth while significantly dampening the volatility of a pure equity portfolio. There is an ongoing debate about whether 60/40 remains optimal in a world of higher inflation and changing bond dynamics. Some argue that allocating 15 to 25 percent to alternative investments — private credit, real assets, infrastructure, managed futures — can improve risk-adjusted returns in ways traditional bonds no longer provide as reliably. We will explore that in a future post. For now, 60/40 remains the standard reference point for a balanced long-term portfolio.
40/60 and More Conservative Allocations
As fixed income weight increases, the portfolio trades growth for stability and income. Appropriate for investors in or near retirement who are drawing from the portfolio and cannot absorb a 40 percent equity decline without disrupting their income — or for money needed within five to ten years.
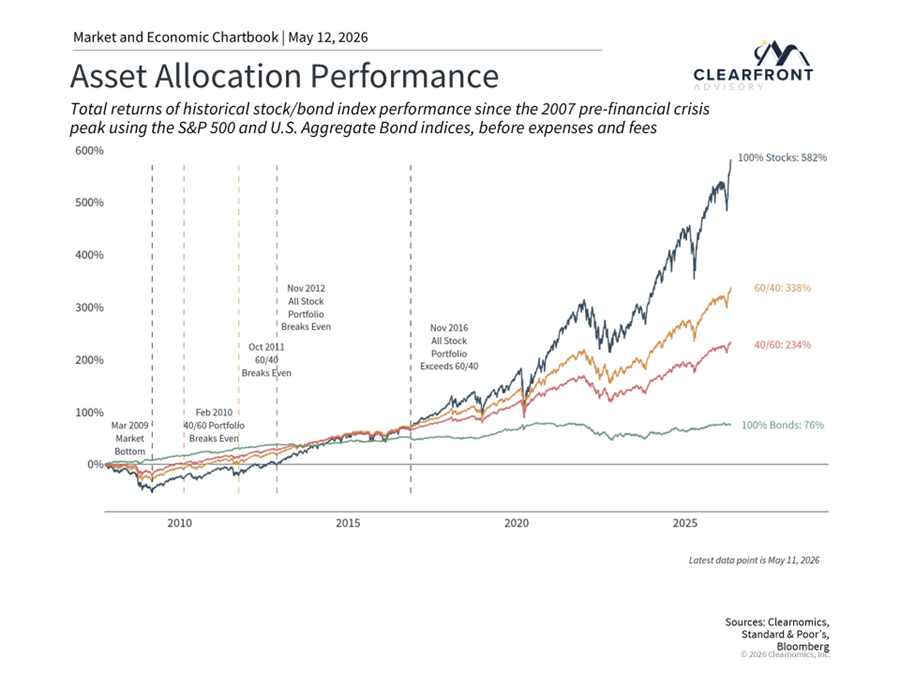
Exhibit 3: Stock/bond mixes reflect a tradeoff between long-run growth potential and short-term drawdowns. Ranges are illustrative and depend on the period and indexes shown in the visual. Source and methodology notes are included in the visual (Clearnomics).
A Practical Framework for Near-Retirees: The Buffer Strategy
One of the more elegant approaches to allocation as retirement approaches comes from advisor and author Nick Murray. His framework pairs a long-term equity-only portfolio with a separate short-term buffer of cash and bonds — roughly two to three years of anticipated living expenses held in stable, liquid assets.
The logic is straightforward. Equity markets decline roughly twice a decade and those declines can last one to three years. If you have two to three years of expenses in cash and short-term bonds, you never have to sell equities at the bottom to pay your bills. You draw from the buffer while the equity portfolio recovers. When equities recover, you replenish the buffer.
The buffer strategy answers the question every near-retiree is really asking: what happens to my income if the market drops 40 percent the year I retire? The answer is: nothing — because that money isn’t in the market.
This separation of “don’t touch” money from “sleep at night” money is psychologically powerful as well as financially sound. It allows an investor approaching retirement to maintain a more aggressive long-term allocation than a blended approach might suggest — because the near-term spending need is already covered and isolated.
Asset Allocation Is Not Set and Forget
A portfolio does not stay at its target allocation on its own. When equities have a strong year, the equity percentage grows above its target. Left unmanaged, a portfolio that started at 60/40 can drift significantly over time. Rebalancing — periodically selling assets that have grown above their target weight and buying those that have fallen below — keeps the portfolio aligned with the investor’s goals and has the practical effect of systematically selling high and buying low.
The Bigger Picture: Your Total Wealth Allocation
Here is where the conversation shifts for business owners — and where most standard asset allocation advice breaks down completely.
Research cited by the Exit Planning Institute’s State of Owner Readiness work indicates that, for many business owners, roughly 75% to 80% of net worth can be concentrated in the equity of their company. The investment portfolio at the brokerage firm — with its carefully considered allocation — may represent only 20% to 25% of total wealth.
Think about what that means in practice. A business owner with a $1 million investment portfolio and a $9 million private company does not have a 60/40 allocation. They have a 90 percent concentration in a single illiquid private equity position — their business — plus a $1 million satellite portfolio on the side. Optimizing the satellite while ignoring the concentration is like adjusting the thermostat while the house is on fire.
Financial author Jared Dillian makes this point compellingly in No Worries: real financial security requires looking at your total wealth picture, not just the accounts at a financial institution. That means accounting for every significant asset — the business, the primary residence, investment real estate, retirement accounts, life insurance cash value, deferred compensation, collectibles, precious metals, cash reserves — and understanding how they interact as a unified whole.
When you map it all out, most business owners discover that their total wealth allocation is far more concentrated and far less diversified than they realized. The investment portfolio they thought was balanced is a rounding error relative to the private company they run every day.
For most business owners, the asset allocation conversation isn’t really about the investment portfolio. It’s about the business. That’s where the real concentration risk lives — and where the real planning opportunity is.
This concentration is not necessarily a problem in the early and middle stages of building a company. Concentration is often how wealth gets created. The problem arises when the owner is approaching the transition out of the business and has not yet built the financial infrastructure to replace the income and wealth the business currently provides.
That process — converting illiquid, concentrated business equity into diversified financial assets in a tax-efficient, planned way — is called exit planning. It is one of the most consequential financial events in a business owner’s life, and it deserves as much attention as any investment decision. We cover exit planning in depth through ClearExit™.
Key Takeaways
- Asset allocation — the mix of asset classes you own — has explained roughly 90% of long-run portfolio return variability in widely cited research. It is typically the most important portfolio-level decision you make.
- The spectrum runs from 100/0 all-equity for long-horizon growth investors to conservative income-oriented allocations for near-retirees drawing from their portfolios.
- The classic 60/40 portfolio remains a durable moderate benchmark, though the role of alternative investments in modern portfolios is an evolving conversation.
- Nick Murray’s buffer strategy — two to three years of living expenses in cash and short-term bonds alongside a long-term equity portfolio — is a powerful framework for near-retirees who want equity-like long-run returns without the income risk of a market downturn.
- For many business owners, research cited by the Exit Planning Institute suggests a large share of net worth (often cited around 75%–80%) can be concentrated in the equity of their company — making the business itself the dominant asset class in their total wealth allocation.
- Real financial planning requires looking at total wealth — business equity, real estate, retirement accounts, collectibles, cash, and all other assets — not just the investment portfolio.
- Converting concentrated, illiquid business equity into diversified financial assets is the central financial challenge of business ownership. That process is exit planning — and it starts long before you’re ready to sell.
Ready to build wealth beyond work?
If most of your wealth is in your business, your asset allocation conversation starts there — not at the brokerage account. ClearCapital™ and ClearExit™ are how we address both sides of that equation. Let’s talk.
Book a 7-minute call with Kevin →
Download the Clearfront Blueprint →
Sources
- Brinson, Hood & Beebower (1986). “Determinants of Portfolio Performance.” Financial Analysts Journal: CFA Institute
- Brinson, Singer & Beebower (1991). “Determinants of Portfolio Performance II.” Financial Analysts Journal: CFA Institute
- Ibbotson & Kaplan (2000). “Does Asset Allocation Policy Explain 40, 90, or 100 Percent of Performance?” Financial Analysts Journal: CFA Institute
- Dillian, J. No Worries: How to Live a Stress-Free Financial Life. McGraw Hill, 2022.
- Murray, N. Simple Wealth, Inevitable Wealth. The Nick Murray Company, 2004.
- Exit Planning Institute — State of Owner Readiness Research: exit-planning-institute.org
This post was researched and written by the author with the assistance of AI writing tools. All content reflects the author’s own views, has been independently verified, and has been reviewed and approved prior to publication.
This material is intended for informational/educational purposes only and should not be construed as investment advice, a solicitation, or a recommendation to buy or sell any security or investment product. Investments are subject to risk, including the loss of principal. Some investments are not suitable for all investors, and there is no guarantee that any investing goal will be met. Diversification does not assure a profit or protect against loss in declining markets, and diversification cannot guarantee that any objective or goal will be achieved. Investing in alternative investments may not be suitable for all investors and involves special risks, such as risk associated with leveraging the investment, utilizing complex financial derivatives, adverse market forces, regulatory and tax code changes, and illiquidity. Past performance is no guarantee of future results. Talk to your financial advisor before making any investing decisions.